
A customer may tell you:
“Our factory uses 20,000 kWh per day.”
That number is useful, but it is not enough to size a commercial battery energy storage system.
Two factories can consume the same amount of electricity every day and still require completely different BESS configurations. One may operate with a stable load for 24 hours. Another may run at low demand most of the day and then jump sharply when several production lines start together.
That is why a commercial load profile is one of the most important inputs before battery storage is designed.
A load profile shows how electrical demand changes over time. For BESS load analysis, the key questions are:
- When does the site use power?
- How high does demand become?
- How long do peaks last?
- How often do they occur?
- How much of the load is stable?
- How much changes during the day?
Those answers determine whether the project needs more battery power in kW, more energy capacity in kWh, or both.
What Is a Commercial Load Profile?
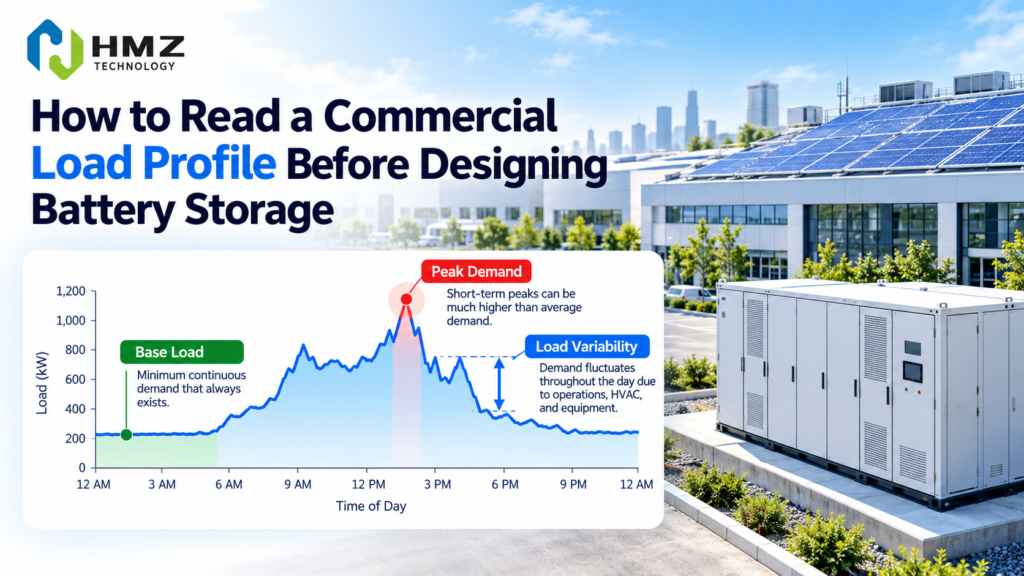
A commercial load profile is a time-based record of electrical demand.
Instead of showing only total monthly energy consumption, it shows how much power the site was using at specific times.
For example:
- 00:00 — 180 kW
- 00:15 — 175 kW
- 00:30 — 182 kW
- 06:00 — 250 kW
- 09:00 — 420 kW
- 13:30 — 610 kW
- 18:00 — 380 kW
When these points are plotted, the operating pattern of the facility becomes visible.
A monthly electricity bill tells you how much energy was purchased.
A commercial load profile tells you when the site needed power and how much it needed at each moment.
Why 15-Minute or 30-Minute Load Data Matters for BESS Load Analysis
Interval data is usually much more useful than monthly totals.
Common interval lengths include:
- 15 minutes
- 30 minutes
- 60 minutes
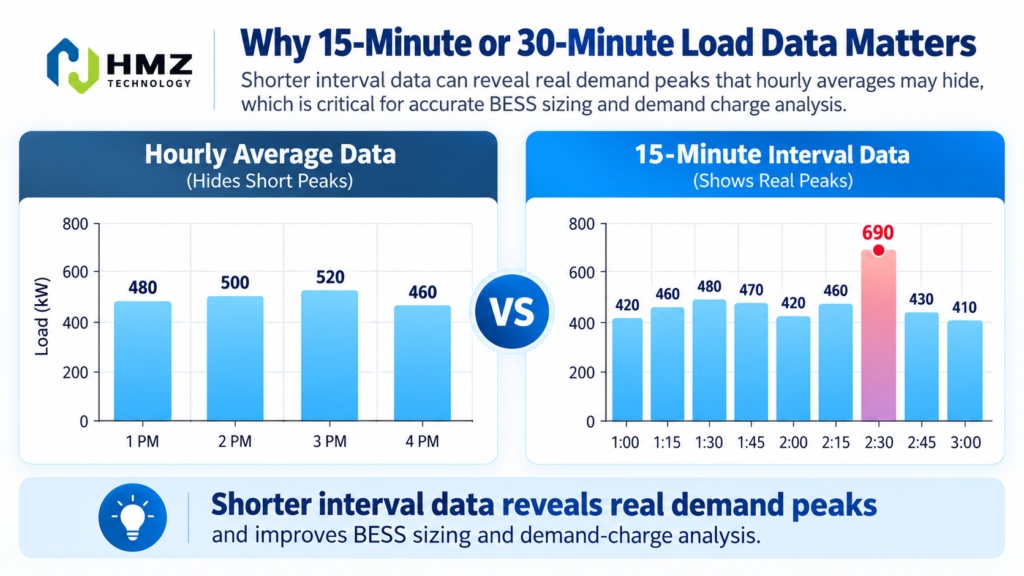
Shorter intervals reveal peaks that hourly averages may hide.
For example, an hourly average may show:
2:00 p.m. to 3:00 p.m.: 500 kW
But the 15-minute data may be:
- 2:00 — 420 kW
- 2:15 — 460 kW
- 2:30 — 690 kW
- 2:45 — 430 kW
The hourly average hides a 690 kW peak.
If demand charges are based on 15-minute demand, that short peak may be financially important.
This is especially important for peak shaving battery storage.
Base Load: The Power the Site Uses Almost All the Time
The base load is the minimum or near-minimum level of demand that remains present for long periods.
It may include:
- refrigeration,
- servers,
- pumps,
- ventilation,
- lighting,
- process controls,
- always-on production equipment.
Suppose a factory rarely falls below:
220 kW
That is approximately its base load.
This matters because the base load helps show how much energy the facility can continuously absorb.
It also matters in solar + storage projects. A strong daytime base load may consume most PV directly, leaving less solar surplus available to charge the battery.
So before sizing storage from installed PV capacity, the project needs to understand how the commercial load profile overlaps with solar generation.
Peak Demand: How High Does the Load Actually Go?
Peak demand is the highest power level reached during a defined period.
It could be:
- daily peak,
- monthly peak,
- seasonal peak,
- annual peak.
A single peak value is useful, but it is not enough.
Suppose the site’s maximum demand is:
800 kW
You still need to know:
- Was it reached once or every day?
- Did it last 15 minutes or three hours?
- What time did it occur?
- Was solar available?
- Was it caused by one machine or normal operation?
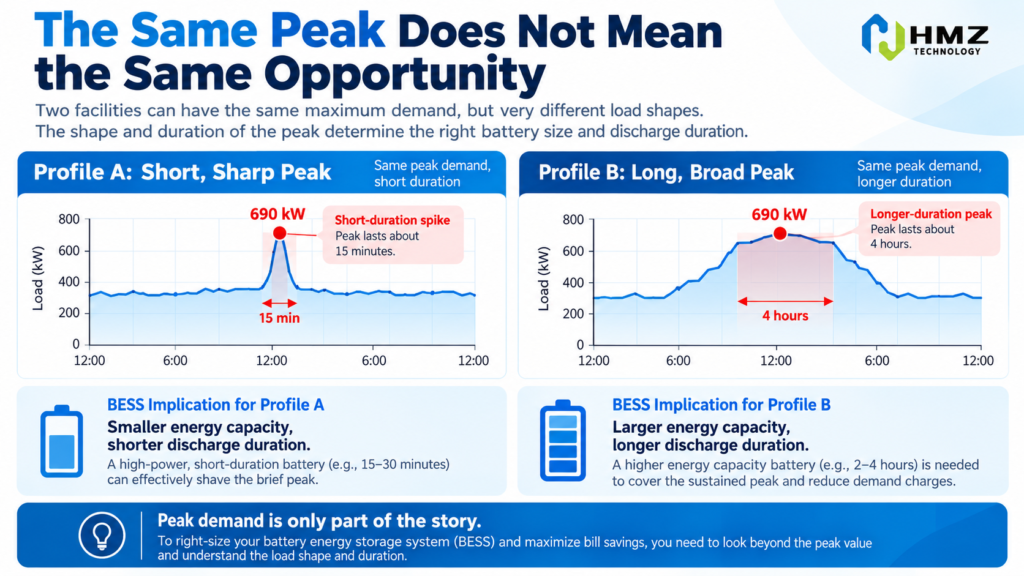
A site that reaches 800 kW for 15 minutes may require a very different battery than one that stays above 700 kW for four hours.
Same Peak kW ≠ Same Battery kWh
Peak Duration Is Just as Important as Peak Height
Battery power is measured in kW.
Battery energy is measured in kWh.
The load profile connects the two.
Suppose a site wants to reduce grid demand by:
200 kW
If the peak lasts 30 minutes:
200 kW × 0.5 h = 100 kWh
If the same peak lasts three hours:
200 kW × 3 h = 600 kWh
The power requirement is the same.
The energy requirement is six times larger.
For a deeper explanation, see kW and kWh in commercial energy storage.
Load Variability: How Stable or Unstable Is the Facility?
Some commercial sites have smooth demand curves.
Others are highly irregular.
A hotel may have predictable morning and evening peaks.
A cold-storage warehouse may show repeated compressor cycles.
A factory may show sharp jumps when heavy equipment starts.
A mining site may have large intermittent loads.
Load variability can affect:
- PCS response speed,
- control margin,
- SOC reserve,
- EMS strategy.
The question is not only:
What is the average load?
It is also:
How quickly can the load change?
Morning Ramp and Evening Decline
The shape of the load curve can reveal how the site operates.
A factory may look like this:
00:00–06:00
Low overnight base load.
06:00–08:00
Production starts and demand rises.
08:00–16:00
High daytime operation.
16:00–18:00
Short production peak.
After 18:00
Demand falls.
That pattern can suggest battery strategies such as:
- morning ramp control,
- afternoon peak shaving,
- midday solar charging,
- evening discharge.
The load profile is not just a graph.
It is a map of how the site actually operates.
How to Identify a Peak-Shaving Opportunity from a Commercial Load Profile
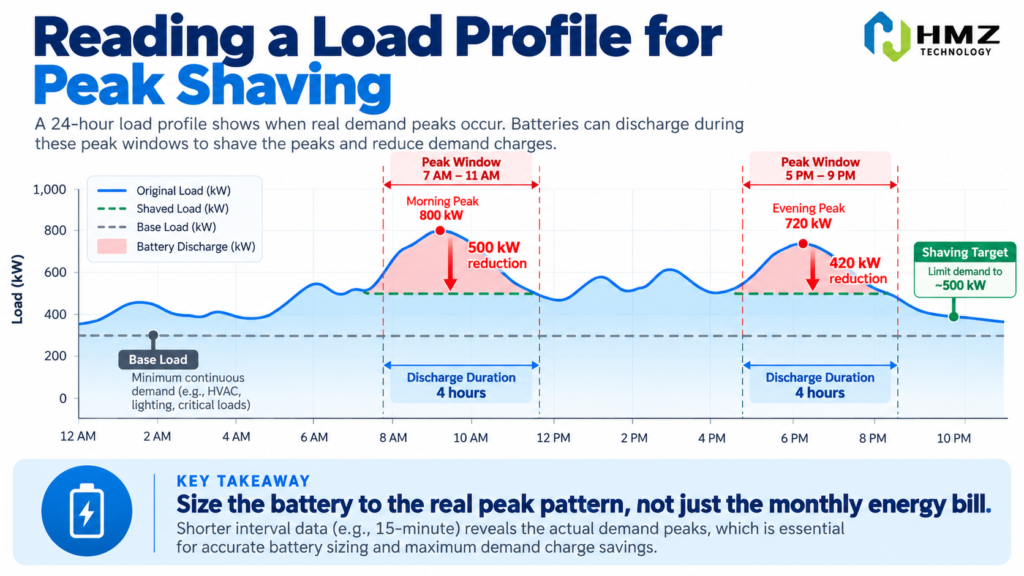
One useful method is to draw a target grid-demand line across the profile.
Suppose the facility reaches:
650 kW
but management wants grid demand kept below:
500 kW
Any load above 500 kW becomes a potential battery-discharge requirement.
In simplified terms:
Battery Power = Actual Load − Grid Target
and:
Battery Energy ≈ Battery Power × Peak Duration
Real design must also account for:
- efficiency,
- usable SOC,
- reserve,
- degradation margin.
A Load Profile Can Also Reveal Solar + Storage Opportunities
A commercial load profile becomes even more useful when compared with PV generation.
If solar peaks around midday while facility demand falls, solar surplus appears.
If the site load rises later while solar falls, storage can shift energy into that period.
The battery can:
charge during solar surplus
and:
discharge during later demand
But if the facility already consumes almost all PV directly, little solar may remain to charge the battery.
For more detail, see adding battery storage to an existing commercial solar system.
Load Profile vs Monthly Electricity Consumption
Consider two factories.
Factory A
Daily consumption:
10,000 kWh
Peak demand:
500 kW
Load pattern:
Relatively flat
Factory B
Daily consumption:
10,000 kWh
Peak demand:
900 kW
Load pattern:
Strong short peaks
Both consume the same daily energy.
Their storage requirements may be very different.
Factory A may benefit from longer-duration energy shifting.
Factory B may need higher battery power for shorter periods.
This is why monthly kWh consumption alone cannot determine BESS sizing.
How Many Days of Load Data Should Be Reviewed?
One day is rarely enough.
Commercial loads can change with:
- weekday vs weekend,
- production schedule,
- season,
- weather,
- occupancy,
- maintenance periods.
A useful review may include:
- representative weekdays,
- weekends,
- high-production periods,
- low-production periods,
- seasonal changes.
For larger projects, a full year of interval data is much more useful than one sample day.
Do Not Size a Battery Around One Abnormal Peak
Suppose a facility normally peaks at:
550 kW
but once reached:
850 kW
That peak may have been caused by:
- commissioning,
- unusual process overlap,
- temporary equipment,
- operational error.
If the battery is sized around that one event, the project may become unnecessarily large.
The key question is:
Will this peak happen again?
If yes, design for it.
If no, it may not justify permanent battery CAPEX.
This connects directly to battery oversizing.
Editor Note — Internal Link
Anchor Text: battery oversizing
Link To: Why Oversizing a Battery Energy Storage System Can Reduce Project Returns
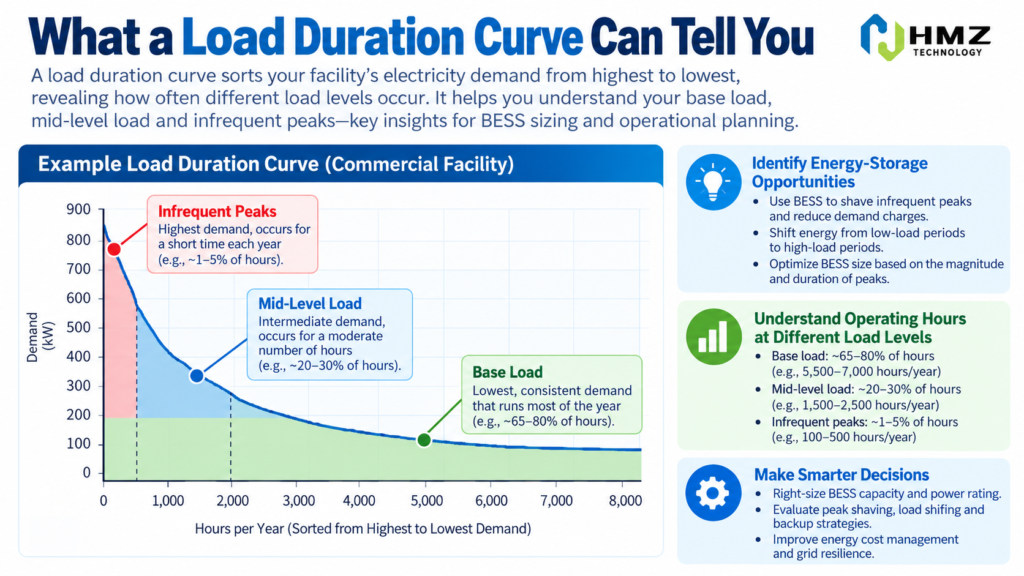
Load Duration Curves: Another Useful View
A daily load profile shows when demand occurs.
A load duration curve shows how often different demand levels occur.
Demand values are sorted from highest to lowest.
For example:
- Load above 700 kW: 1% of operating time
- Load above 600 kW: 8%
- Load above 500 kW: 25%
- Load above 300 kW: 80%
This can help show whether high demand is a short recurring peak or a long-duration condition.
Why the Same Commercial Load Profile Can Lead to Different BESS Designs
The battery objective changes the interpretation.
If the objective is Peak Shaving
Focus on:
- maximum demand,
- grid target,
- peak duration.
If the objective is Backup
Focus on:
- critical load,
- outage duration.
If the objective is Solar Self-Consumption
Focus on:
- daytime load,
- PV surplus,
- evening demand.
If the objective is TOU Optimization
Focus on:
- high-price period load,
- low-price charging window.
The load data does not change.
The interpretation does.
What Data Should a Customer Send for BESS Load Analysis?
A useful first package includes:
Load Data
- 15-minute or 30-minute interval load
- several representative days
- ideally several months or one year
Electricity Data
- monthly bills
- tariff schedule
- demand charges
- TOU periods
Solar Data
If PV exists:
- installed capacity
- hourly generation
- export data
Backup Information
- critical-load kW
- required backup duration
Site Information
- transformer capacity
- grid connection capacity
- future load expansion
This produces a much more meaningful recommendation than asking only:
“How much is a 500 kWh battery?”
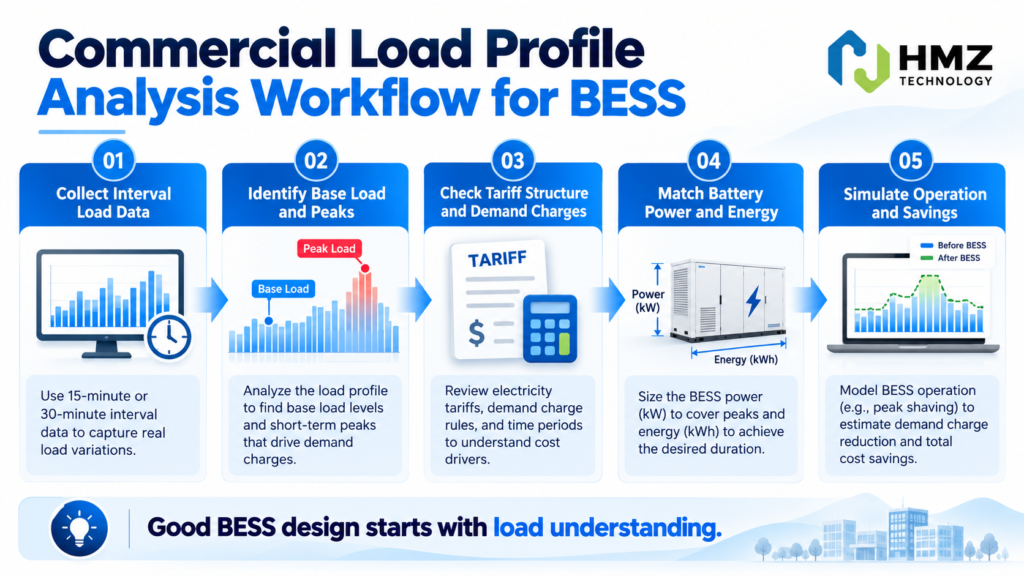
A Practical BESS Load Analysis Workflow
Step 1 — Collect Interval Data
15-minute or 30-minute load profile.
Step 2 — Identify Base Load
Determine the minimum stable demand.
Step 3 — Identify Peak Demand
Find the highest recurring demand.
Step 4 — Measure Peak Duration
Understand how long each peak lasts.
Step 5 — Check Load Variability
Look for rapid ramps and intermittent loads.
Step 6 — Compare Tariff Periods
Determine whether peaks occur during expensive periods.
Step 7 — Compare PV Generation
If solar exists, identify charging opportunities.
Step 8 — Define Battery Objective
Peak shaving, shifting, backup or combined operation.
Step 9 — Size Required kW
Determine instantaneous battery power.
Step 10 — Size Required kWh
Determine required usable energy.
How HMZ Technology Uses Commercial Load Profile Data
For a commercial storage project, HMZ does not need only a target battery capacity.
A more useful starting point is:
- interval load profile,
- daily energy consumption,
- maximum demand,
- peak duration,
- tariff structure,
- existing PV,
- critical loads,
- backup requirement.
From there, the project can determine whether the main requirement is:
- high power,
- longer energy duration,
- or both.
HMZ’s current C&I storage portfolio includes:
50kW / 112kWh All-in-One C&I ESS
Suitable for smaller commercial facilities, distributed PV + storage and light industrial applications.
125kW / 241kWh All-in-One C&I ESS
Suitable for larger C&I energy-management applications.
125kW / 261kWh Liquid-Cooled C&I ESS
Suitable for higher-duty applications requiring more precise thermal management and frequent operation.
Learn more about our 50kW/112kWh and 125kW/241kWh All-in-One C&I Energy Storage Systems.
Commercial Load Profile Checklist Before BESS Sizing
Before selecting equipment, confirm:
Interval Data
- 15-minute or 30-minute data available
- normal weekdays reviewed
- weekend data reviewed
- seasonal variation reviewed
Load Characteristics
- base load identified
- maximum demand identified
- peak duration identified
- peak frequency identified
- load ramps identified
Economics
- demand-charge structure confirmed
- TOU pricing confirmed
- electricity tariff reviewed
Solar
- PV output reviewed
- solar surplus quantified
- export behavior reviewed
Project Objective
- peak shaving
- TOU optimization
- solar self-consumption
- backup
- generator reduction
The better the load data, the better the BESS design.
Conclusion
A commercial load profile is one of the most important inputs in battery storage design.
Monthly electricity consumption tells you how much energy the site used.
It does not tell you:
- when the energy was used,
- how high demand became,
- how long peaks lasted,
- or how quickly the load changed.
For commercial load profile analysis, the useful questions are:
What is the base load?
Where is the peak?
How long does it last?
How often does it happen?
How does it overlap with solar and electricity tariffs?
Once those questions are answered, BESS sizing becomes much more grounded.
Instead of choosing a battery from a catalogue first, the required kW and kWh can be defined from the site’s actual operating behavior.
Asked Questions
What is a commercial load profile?
A commercial load profile is a time-based record showing how a facility’s electrical demand changes throughout the day, week or year.
Why is 15-minute load data useful for BESS sizing?
Short interval data can reveal demand peaks hidden by hourly or monthly averages. This is particularly important for demand-charge management and peak shaving.
What is base load?
Base load is the minimum or stable level of electrical demand that remains present for long periods at a facility.
What is peak demand?
Peak demand is the highest power level in kW reached by the facility during a defined period.
Why does peak duration matter?
Peak duration determines how much battery energy in kWh is needed. The same kW reduction can require very different battery capacities depending on whether the peak lasts 15 minutes or several hours.
How much load data is needed before designing a BESS?
Several representative days are better than one day, while several months or a full year of interval data can reveal seasonal and operational variations.