
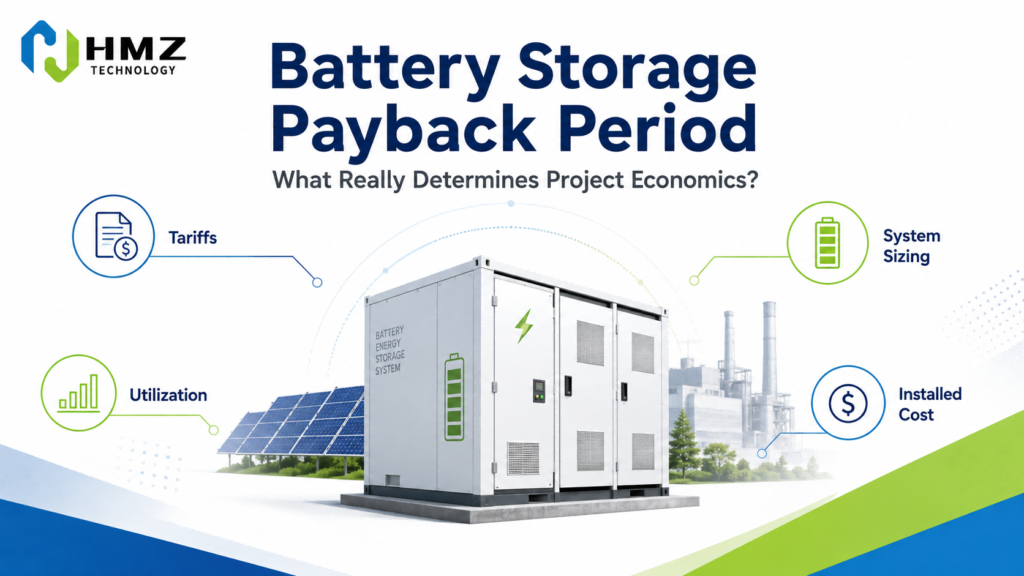
When a business starts looking at commercial battery storage, the payback question usually comes very early.
How many years will it take to recover the investment?
There is nothing wrong with asking that. The problem starts when someone tries to answer it before looking at the site’s electricity data.
A 500 kWh battery does not have a fixed five-year, six-year or seven-year payback period.
Put the same system in two factories and the result can be completely different.
One factory may have a large demand charge, a predictable afternoon peak and excess rooftop solar around noon. Its battery has something useful to do almost every day.
Another factory may pay a flat electricity tariff, have very little solar surplus and rarely experience a demand peak that storage can reduce.
Same battery.
Very different economics.
That is why commercial BESS payback should be calculated from the site’s operating conditions outward—not from the battery price inward.
What Does “Payback Period” Actually Mean?
At the simplest level:
Payback Period = Total Project Investment ÷ Annual Net Benefit
If a complete battery storage project costs USD 180,000 and produces USD 36,000 in net annual savings, the simple payback period is five years.
Useful? Yes.
Complete? No.
That number does not tell you what happens as the battery degrades, what financing costs, whether electricity prices change, or whether the system needs major replacement work later in life.
For an early project screen, simple payback is fine.
For an investment decision, it should sit alongside a longer-term cash-flow model.
Start With the Electricity Bill—But Do Not Stop There
A monthly electricity bill can tell you how much energy the site used and, in some markets, its maximum demand.
It usually cannot tell you exactly when those peaks happened.
That matters.
Suppose a factory consumes roughly 90,000 kWh per month. On the surface, that sounds like useful sizing information.
Now look at the 15-minute load data.
Perhaps most of the plant sits between 280 and 350 kW, but three production events each afternoon push demand above 500 kW for 20–30 minutes.
That is a much more useful piece of information for battery storage.
A system designed around those peaks may be able to reduce demand charges without needing enough energy to run the whole factory for hours.
This is also where many early-stage battery quotations go wrong: the project is sized from monthly kWh instead of the actual load curve.
Factor 1: Electricity Tariff Structure
Before discussing battery capacity, look at how the customer is billed.
If electricity costs almost the same at 2:00 a.m. and 6:00 p.m., there may be very little opportunity for time-of-use arbitrage.
If the tariff changes sharply between off-peak and peak hours, the picture is different.
Imagine:
- Off-peak electricity: USD 0.08/kWh
- Peak electricity: USD 0.18/kWh
There is a USD 0.10/kWh spread before losses.
A battery can charge in the cheaper period and discharge when electricity is more expensive.
But do not multiply that USD 0.10 directly by the battery’s nameplate capacity and call it profit.
Some energy is lost in the PCS and battery. Cooling and auxiliary systems consume power. A portion of the battery may also be reserved rather than cycled through its full nominal capacity.
The tariff spread creates the opportunity. The operating model determines how much of that opportunity is actually captured.
Factor 2: Demand Charges
For some C&I users, the biggest storage value does not come from shifting kWh.
It comes from controlling kW.
Consider a factory that usually operates around 350–400 kW but reaches 550 kW when several production lines overlap.
If the utility bills demand based on that monthly maximum, a short 550 kW event can affect the entire month’s bill.
A battery does not need to power the whole factory.
It may only need to cover part of that peak:
Facility demand: 550 kW
Grid target: 400 kW
Battery contribution: 150 kW
If the peak lasts 30 minutes, the energy requirement is very different from backing up 150 kW for four hours.
This is why looking only at battery kWh is dangerous.
For peak shaving, PCS power can be just as important as stored energy.
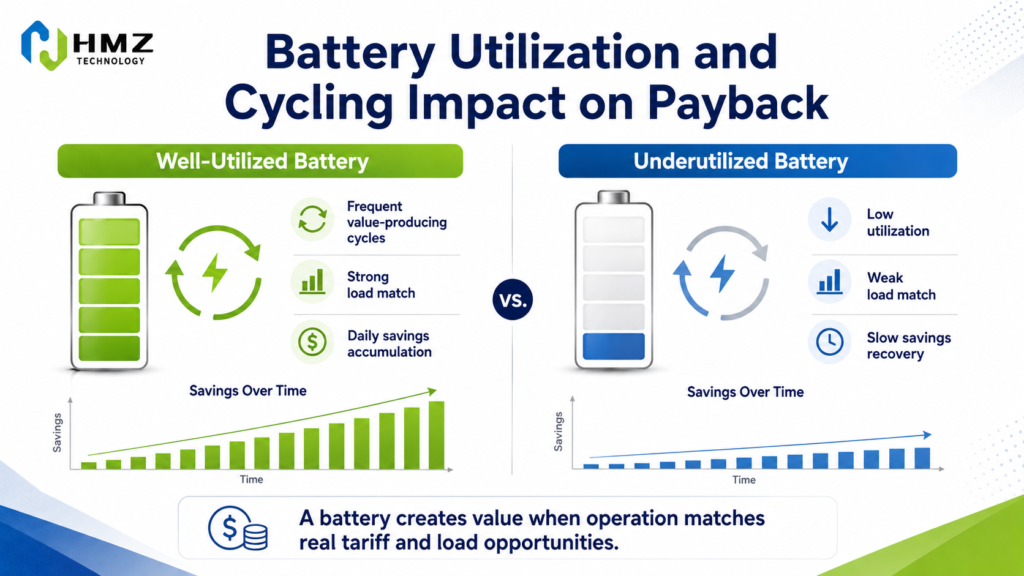
Factor 3: Battery Utilization
Battery storage only creates value when it is used.
An idle battery does not produce financial savings.
This sounds obvious, but utilization is often overlooked when projects are sized.
Consider a 1,000 kWh system.
If the site only uses 200–300 kWh of that capacity on most days, a large portion of the installed asset may remain economically underutilized.
That means the business paid for capacity that does not regularly create value.
Higher utilization can improve project economics, but only when the cycles themselves create meaningful savings.
The goal should not be:
Use the battery as much as possible.
The goal should be:
Use the battery when operation creates sufficient economic or operational value.
Factor 4: Battery Cycling Frequency
Cycling frequency directly affects both value creation and battery aging.
A project with consistent daily peak shaving or energy shifting opportunities may cycle the battery frequently.
Another project may only use the battery a few times each month.
The first project may generate more annual savings.
However, every cycle contributes to battery degradation.
So there is an economic trade-off.
A strong project strategy should answer:
- How often should the battery cycle?
- How deep should each cycle be?
- What financial value does each cycle create?
- Is backup reserve required?
- Does frequent cycling reduce future usable capacity too quickly?
A good EMS helps manage this balance.
Factor 5: Solar Self-Consumption
Battery storage can significantly change the economics of a commercial solar system.
Solar generation is often strongest around midday.
But business electricity demand may not follow the same pattern.
Without a battery, excess solar may be:
- Exported to the grid
- Curtailed
- Sold at a low feed-in rate
Battery storage allows some of this energy to be used later.
The operating logic becomes:
Solar PV → Load
Then:
Excess Solar → Battery
Later:
Battery → Load
The financial value depends on the difference between:
Grid electricity purchase price
and
Export value of solar energy
If the business pays a high retail electricity price but receives little compensation for exported solar, increasing self-consumption can improve project economics.
This is especially relevant for factories and commercial buildings with large rooftop PV systems.
Factor 6: System Sizing
One of the biggest mistakes in BESS economics is assuming that a larger battery automatically creates more savings.
It does not.
Oversizing can increase:
- Capital expenditure
- Installation cost
- Cooling requirements
- Space requirements
without creating proportional increases in annual benefit.
The correct battery size depends on the application.
For Peak Shaving
Power capability in kW may be the main constraint.
For Energy Shifting
Usable battery energy in kWh becomes more important.
For Backup Power
Both required power and backup duration matter.
For Solar Self-Consumption
Battery capacity should reflect the amount of excess solar actually available.
This is why BESS sizing should start with load and operating data rather than with a predefined cabinet capacity.
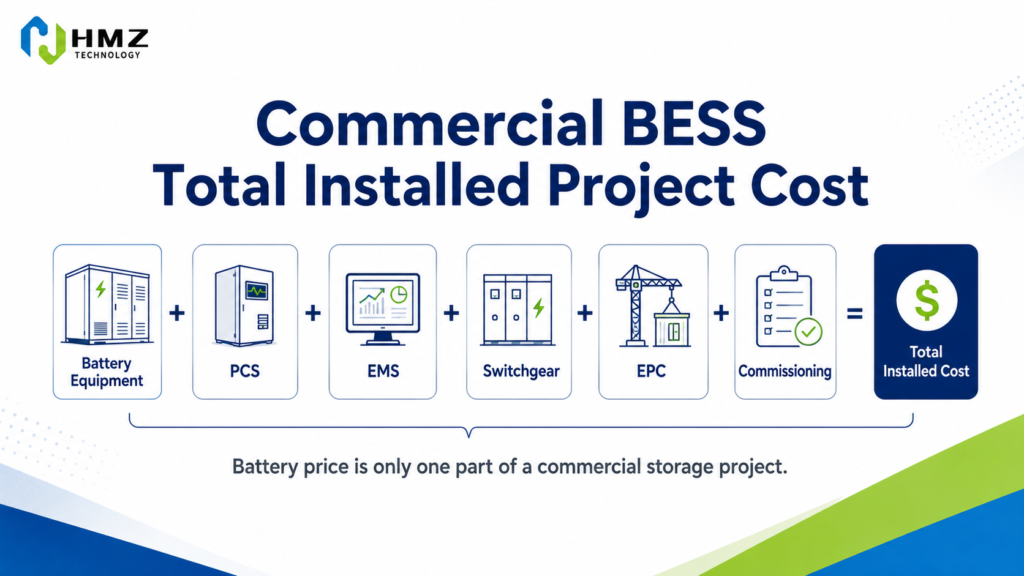
Factor 7: Total Installed Project Cost
Battery equipment is only one part of a commercial storage project.
A realistic payback model should consider total installed cost.
This may include:
- Battery system
- PCS
- EMS
- Switchgear
- Protection equipment
- Transformer or electrical upgrades
- Installation
- Engineering
- Commissioning
- Civil works
- Transportation
- Permits where required
A quotation that only compares battery cabinet prices may therefore give an incomplete picture of the real investment.
Two suppliers may offer similar battery prices but very different system integration requirements.
That difference can materially affect payback.
Factor 8: System Efficiency
Energy storage systems consume and lose energy during operation.
Power passes through:
- PCS
- Battery charging
- Battery storage
- Battery discharge
- Electrical conversion
Cooling and auxiliary systems also consume power.
This means:
100 kWh charged into the system
does not necessarily equal
100 kWh delivered back to the load.
Lower system efficiency reduces the economic benefit of every energy-shifting cycle.
For projects relying heavily on time-of-use arbitrage, even relatively small efficiency differences can influence long-term economics.
Factor 9: Battery Degradation
Battery capacity does not remain constant forever.
Over time, usable capacity gradually declines.
The degradation rate depends on factors including:
- Battery chemistry
- Temperature
- Depth of discharge
- Charge/discharge rate
- Cycling frequency
- SOC range
This matters because financial models often assume future annual savings.
If usable battery capacity decreases, future energy-shifting capability may also decline.
Therefore, a realistic model should not assume that Year 10 performs exactly like Year 1.
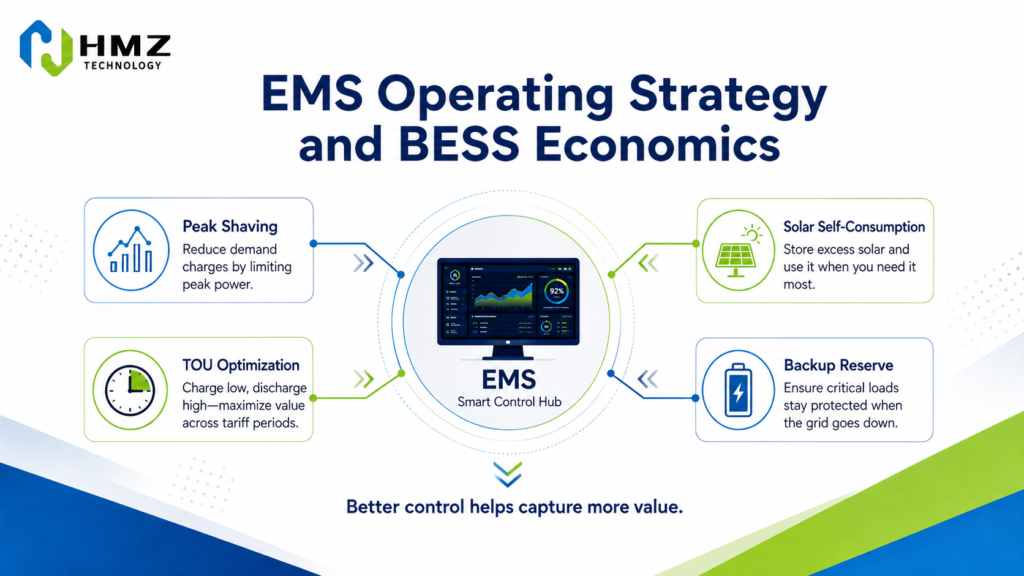
Factor 10: EMS Operating Strategy
The same battery can produce very different financial results depending on how it is controlled.
An EMS can monitor:
- Electricity tariff
- Load demand
- Battery SOC
- Solar generation
- Grid import
- Generator operation
and decide when charging or discharging creates the most value.
Examples:
Peak Shaving
Discharge when demand approaches a target limit.
Time-of-Use Optimization
Charge during low-price periods and discharge during high-price periods.
Solar Self-Consumption
Store excess PV generation for later use.
Backup Reserve
Maintain minimum battery SOC for outages.
The challenge is that these objectives can sometimes compete with each other.
For example:
Using more battery capacity for daily energy arbitrage may increase savings.
But it may reduce the energy available for emergency backup.
That is why the operating strategy must reflect the customer’s real priorities.
Backup Power Can Change the Economics
Not every BESS benefit appears directly on the electricity bill.
Backup power is a good example.
Consider a food-processing factory.
If a grid outage interrupts refrigeration or production, the cost may be much greater than the value of the electricity itself.
A battery that keeps critical loads operating may prevent:
- Lost production
- Product spoilage
- Equipment restart costs
- Business interruption
This value can be difficult to express as a simple monthly saving.
But for some businesses, resilience may be one of the main reasons for investing in storage.
That means the project should distinguish between:
Direct Financial Savings
such as:
- Demand-charge reduction
- Time-of-use savings
- Increased solar self-consumption
and:
Avoided Operational Losses
such as:
- Reduced downtime
- Reduced production losses
- Improved continuity
Both matter, but they should not be mixed without clear assumptions.
Generator Savings Can Also Affect Payback
The same applies to diesel savings.
In weak-grid projects, battery storage can reduce:
- Generator runtime
- Unnecessary starts
- Low-load operation
- Fuel consumption
But the number should come from actual generator data.
How many hours does the generator currently run?
At what load?
What is the real fuel consumption?
How much does diesel cost locally?
Once those numbers are known, the value of storage becomes much easier to defend.
Without them, “diesel savings” is just a marketing phrase.
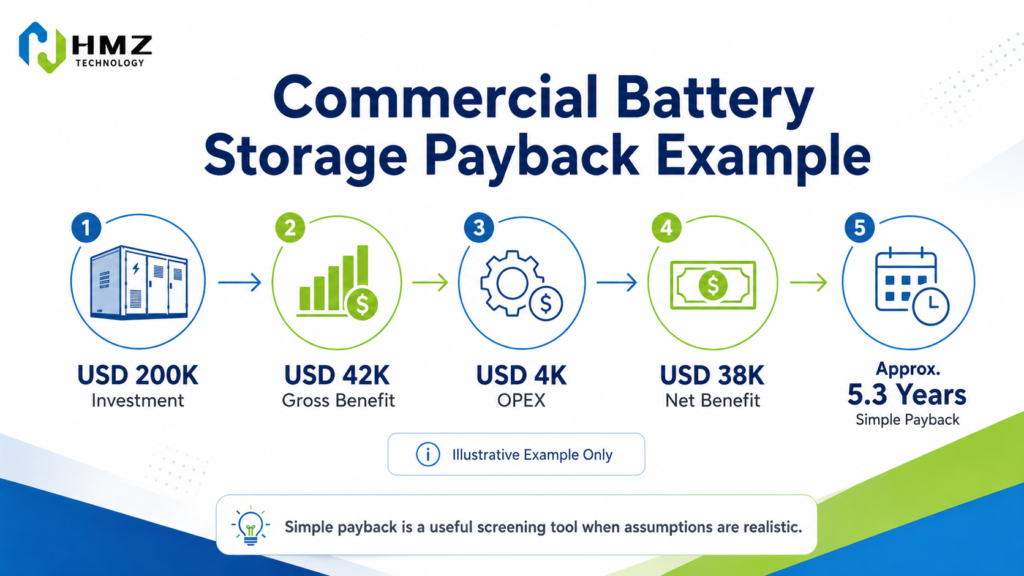
A Simple Payback Example
Consider a commercial project with a total installed cost of USD 200,000.
The operating model estimates:
- Peak shaving savings: USD 15,000/year
- Time-of-use savings: USD 12,000/year
- Increased solar self-consumption: USD 10,000/year
- Generator savings: USD 5,000/year
Gross annual benefit:
USD 42,000
Annual operating and maintenance cost:
USD 4,000
Net annual benefit:
USD 38,000
Simple payback:
USD 200,000 ÷ USD 38,000 ≈ 5.3 years
That 5.3-year figure is not a promise.
It is the output of a set of assumptions.
Change the demand charge, cycling schedule, installed cost or actual solar surplus and the answer changes with them.
That is exactly how a payback model should be treated.
What Usually Makes a Stronger BESS Business Case?
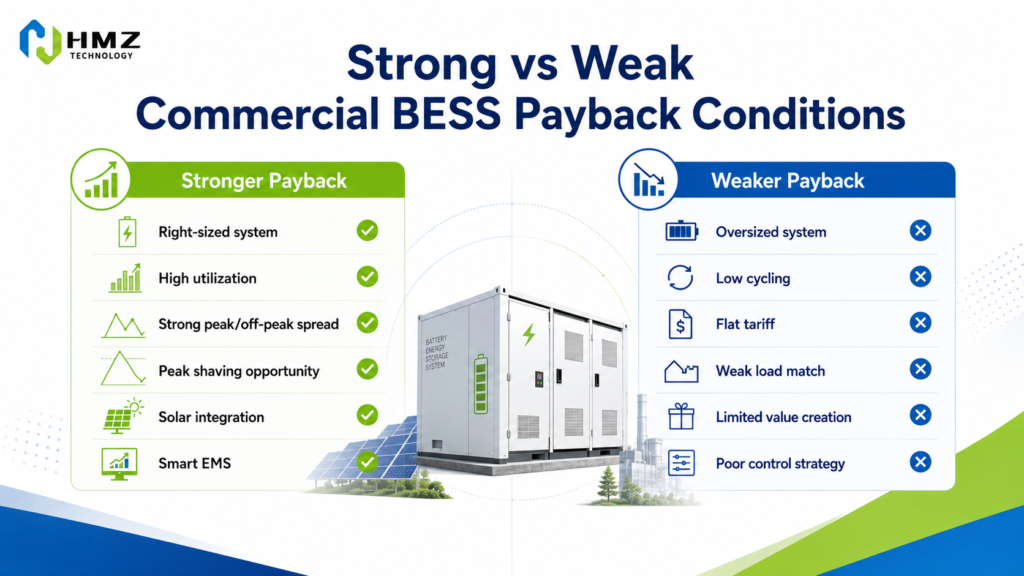
Certain site conditions tend to give storage more useful work to do:
- Meaningful peak/off-peak tariff differences
- High demand charges
- Regular peak events
- Excess solar with low export value
- High generator fuel costs
- Expensive operational downtime
A project with several of these conditions can often stack more than one value stream.
For example, the battery may absorb excess PV at midday, shave a late-afternoon demand peak and still keep part of its SOC in reserve for an outage.
That is a much stronger use case than installing storage on a site simply because “battery prices are falling.”
How HMZ Technology Looks at Project Economics
For a commercial storage project, the useful starting information is not a battery model number.
It is usually:
- The site’s load profile
- Peak demand
- Electricity tariff
- Existing PV capacity
- Generator operation
- Grid reliability
- Backup requirement
From there, battery power and energy capacity can be matched to the actual job the system needs to perform.
HMZ’s C&I storage portfolio includes configurations such as:
50kW / 112kWh All-in-One C&I Energy Storage System
For smaller commercial facilities, distributed solar-plus-storage and light industrial applications.
125kW / 241kWh All-in-One C&I Energy Storage System
For larger commercial and industrial energy-management applications.
125kW / 261kWh Liquid-Cooled C&I Energy Storage System
For applications requiring higher energy density, more precise thermal management and more demanding operating conditions.
Those capacities are starting points for system configuration, not substitutes for project analysis.
A 125kW/261kWh system can be a good fit for one site and the wrong fit for another.
The load data decides.
Before Asking “How Fast Does It Pay Back?”, Ask These Questions
Before calculating a payback period, a project team should be able to answer:
- When does the site’s maximum demand occur?
- How long do the peaks last?
- Is there a meaningful peak/off-peak tariff difference?
- How much PV is currently exported or curtailed?
- How much battery capacity can actually be used each day?
- Is backup reserve required?
- What is the complete installed project cost?
- How will the EMS prioritize competing objectives?
If those answers are available, the payback calculation becomes much more useful.
If they are not, a three-year or five-year payback claim is mostly guesswork.
Conclusion
Commercial battery storage economics are site-specific.
The battery price matters, but it is only one variable.
A project with a relatively expensive system can still perform well when it addresses costly demand peaks, captures otherwise low-value solar energy and is used consistently.
A cheap system can perform poorly if it is oversized, rarely cycles or is installed behind a tariff that gives storage very little opportunity to create value.
So before comparing batteries by USD/kWh, compare the jobs they are expected to perform.
That is where the real payback calculation begins.
FAQ Schema
Question 1
What is a normal commercial battery storage payback period?
Answer
There is no universal number. Payback depends on local tariffs, demand charges, load profile, utilization, total installed cost and operating strategy.
Question 2
Does a lower battery price always shorten payback?
Answer
No. Lower equipment cost helps reduce initial CAPEX, but poor sizing or low utilization can still result in weak project economics.
Question 3
What usually has the biggest effect on BESS payback?
Answer
For many commercial and industrial projects, electricity tariffs, demand charges, load profile, system utilization and total installed project cost are among the most important variables.
Question 4
Can peak shaving improve payback?
Answer
Yes, particularly when the customer pays meaningful demand charges and has predictable short-duration peaks that a battery can reduce.
Question 5
Can solar PV improve battery economics?
Answer
Yes, especially when excess PV would otherwise be exported at a low tariff or curtailed. Battery storage can shift that energy to periods when it has greater value.
Question 6
Should backup value be included in BESS economics?
Answer
It can be included, but avoided downtime and resilience benefits should be modeled separately from direct electricity-bill savings and based on realistic operating consequences.
Build Your Intelligent Energy Future with HMZ
HMZ Technology helps businesses move beyond traditional solar systems by combining solar PV, battery storage and intelligent microgrid control.
Our integrated energy solutions are designed for industrial facilities, commercial buildings and remote energy applications requiring reliable, efficient and flexible power.
Contact HMZ Technology today to explore your next solar storage or microgrid project.
Related Insights from HMZ Technology
Industrial energy management is rapidly evolving. While rooftop solar PV provides an effective way for factories to generate clean electricity, many businesses are now looking beyond solar generation and exploring integrated solutions such as energy storage, intelligent energy management, and microgrid systems.
To better understand how commercial and industrial users can optimize their energy strategy, explore more insights from HMZ Technology’s renewable energy knowledge center, including solar PV solutions, C&I energy storage systems, and practical applications for industrial energy management.